
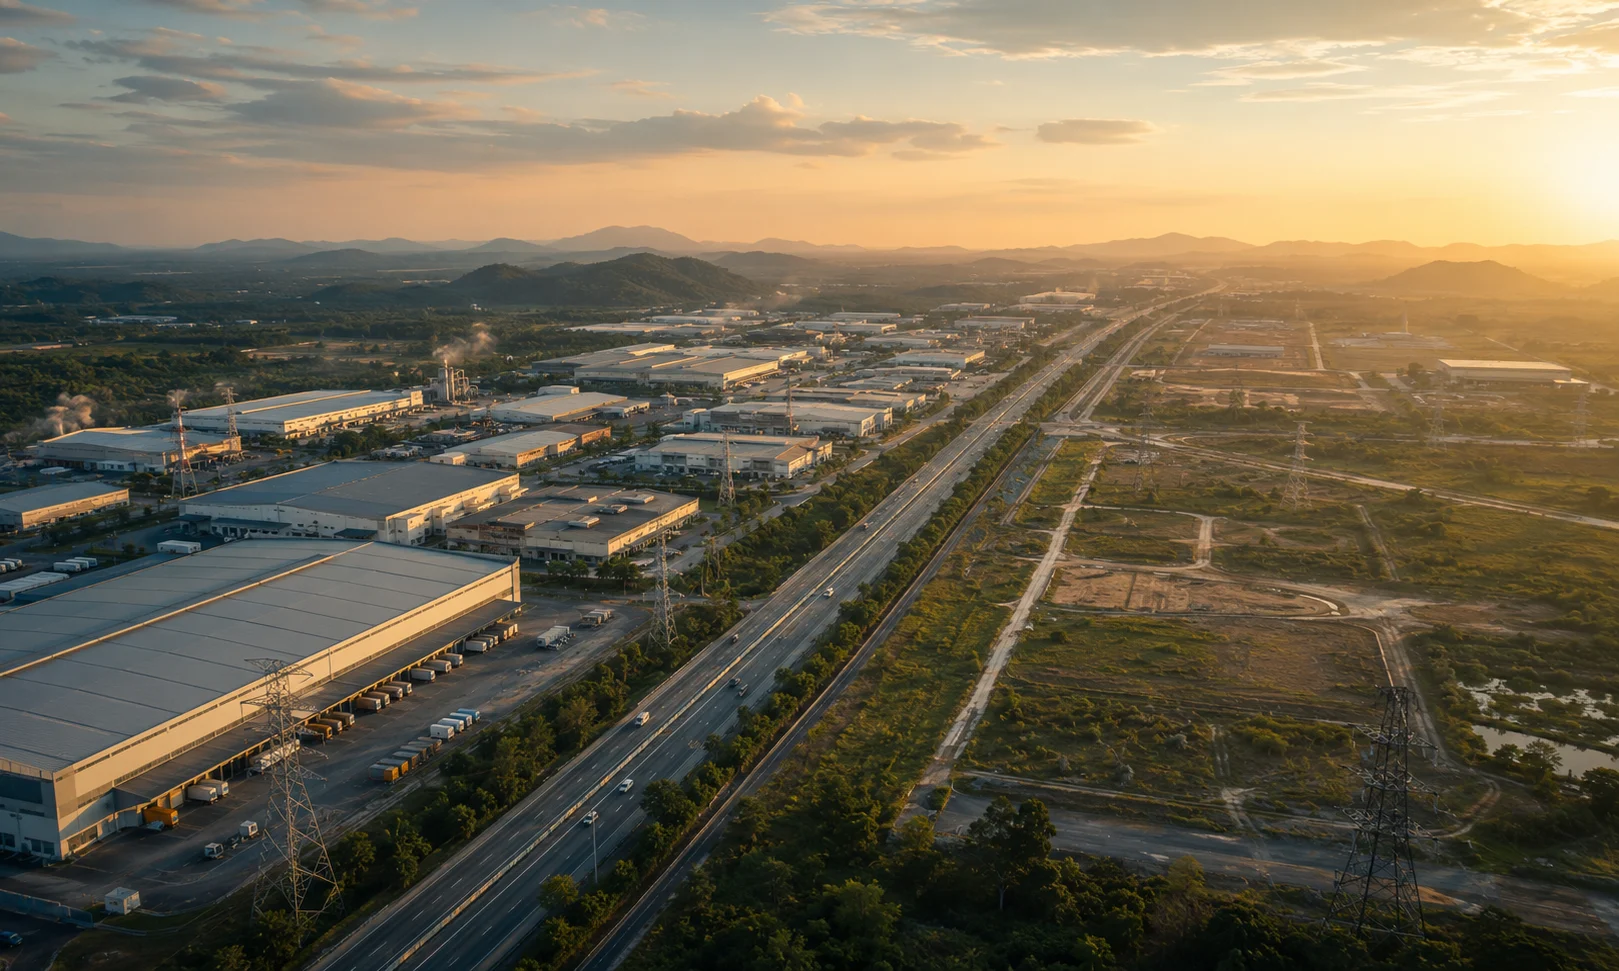

NAPIC’s 2025 data confirms an expanding market. H1 2026 signals show the next phase may depend on the corridor, and the site, you choose.
Industrial property Malaysia data shows a market that has grown for two years running. National industrial transaction value rose 21.3% in 2025, reaching RM33.80 billion. That is the fastest pace of any property subsector NAPIC tracks.
A national figure does not apply evenly to every site.
At Hartamas Industrial, we work with manufacturers, logistics operators, and investors. Our clients look at sites across the Klang Valley, Johor, Penang, and the Vision Valley corridor in Negeri Sembilan.
This article sets out what the confirmed NAPIC data shows. It also outlines a four-factor framework that can help when assessing a specific site for H2 2026.
TL;DR — Quick Summary
- Value-led, not activity-led: national industrial property value rose 21.3% to RM33.80 billion in 2025, while transaction volume grew 1.4%.
- Selangor remains the largest market by value: RM15.01 billion in 2025, though annual growth eased from 15.7% to 11.0%.
- Data-centre proximity alone does not indicate value uplift: TNB assesses power and water capacity before approving new projects.
- The JS-SEZ master plan is approved but not yet publicly launched: delayed twice, now targeted for Q4 2026.
- Four factors can help indicate site strength: power allocation, title readiness, sector overlap, and infrastructure timing.
Table of Contents
Is Industrial Property Still Growing in Malaysia in 2026?
Malaysia’s industrial property market grew in value through 2025. NAPIC’s confirmed full-year data is the most complete picture available as H2 2026 begins.
- 8,910 industrial transactions were recorded nationwide in 2025, worth RM33.80 billion.
- Transaction volume rose 1.4% year on year.
- Transaction value rose 21.3%, the third straight year of double-digit growth.
- Selangor recorded 3,179 transactions worth RM15.01 billion, up 11.0% from RM13.53 billion in 2024.
- Johor recorded RM9.57 billion across 1,613 transactions.
- Selangor’s unsold completed industrial units fell 37.8%, from 45 units in 2024 to 28 units in 2025.
(Source: NAPIC Property Market Report, 2025)
|
Malaysia Industrial Property at a Glance (Latest Confirmed NAPIC Data, FY2025) |
|---|
|
National: 8,910 transactions, RM33.80 billion, +21.3% value Selangor: 3,179 transactions, RM15.01 billion, +11.0% Johor: 1,613 transactions, RM9.57 billion Penang: 490 transactions, RM1.85 billion Existing industrial stock: over 125,000 units nationwide, end-2025 |
Does Being Near a Data Centre Increase Industrial Land Value?
Not automatically. Proximity to an announced data centre does not by itself indicate land value uplift. Power and water capacity increasingly influence which projects go ahead.
For much of 2023 and 2024, an announced data centre nearby was often treated as a positive signal. That assumption appears to be weakening in 2026.
- In a Dewan Rakyat sitting on 7 July 2026, the Energy Transition and Water Transformation Minister said TNB carries out a technical assessment of grid capacity before approving new power supply applications.
- The example cited applies to hyperscale data centre projects in Serendah, Selangor, where three projects are currently seeking electricity supply.
- Approval depends on whether the existing and planned grid can accommodate the additional demand, the Minister said.
The scale of demand nationally gives some context:
- TNB supplied 36 operating data centres with about 4.5 gigawatts of capacity through Q1 2026.
- A further 23 data centres under construction require about 3.8 gigawatts.
- National peak demand is projected to rise from 21.3 gigawatts in 2026 to 33.5 gigawatts by 2035.
- TNB has been allocated RM43 billion in grid capital expenditure for 2025 to 2027.
Sites without a confirmed power allocation may carry more execution risk. This can apply regardless of how close they sit to a data-centre announcement.
|
Myth vs Reality |
|---|
|
Myth: “Land near a data centre announcement is a safe industrial bet.” Reality: Land tends to benefit once TNB confirms power allocation and water supply for that specific site. An announcement alone does not indicate this has happened. |
Pro Tip: Requesting a site’s TNB queue position and confirmed connection date in writing can help before treating a data-centre neighbour as a positive factor in valuation.
What Four Factors Can Help Identify a Strong Industrial Site?
Four factors can help indicate how an industrial site compares to the wider market in 2026: power allocation, title readiness, sector overlap, and infrastructure timing.
- Power allocation status. A site’s position in TNB’s queue can matter more than its distance from the grid.
- Land and title readiness. Freehold land tends to move faster than leasehold. Conversion status is worth checking before committing.
- Sector overlap. A site inside a genuine demand cluster, semiconductor, E&E, or logistics, may carry less risk than generic industrial land nearby.
- Infrastructure catalyst timing. It can help to check whether a driver such as JS-SEZ, RTS Link, or a data-centre project is already priced into asking rates, or still ahead of it.
This is the working framework we use at Hartamas Industrial to brief clients. It is not a formal certification. It works best as a starting checklist alongside site-specific due diligence.
Related reading: How to Expand Your Manufacturing Operations into Malaysia
Pro Tip: A site can score well on three factors and still carry risk if the fourth, timing, means paying today for value that may only arrive by 2028.
How Do Klang Valley, Johor, Penang, and Vision Valley Compare for Industrial Property?
Klang Valley leads on transaction value. Johor leads on infrastructure catalysts. Penang shows steadier, more moderate growth. Vision Valley remains an earlier-stage corridor.
|
Corridor |
2025 Value (NAPIC) |
Dominant Driver |
Points to Watch |
|---|---|---|---|
|
Klang Valley (Selangor) |
RM15.01 billion |
Data-centre and logistics demand; Port Klang access |
Annual growth eased from 15.7% to 11.0%; TNB now assesses grid capacity before new DC approvals |
|
Johor |
RM9.57 billion |
JS-SEZ momentum; RTS Link (Dec 2026) |
JS-SEZ master plan approved but not yet publicly launched; targeted Q4 2026 |
|
Penang |
RM1.85 billion |
Seberang Perai Tengah factory demand |
Smaller base than Selangor or Johor; price growth (2.6%-8.2%) tracked a similar range to the larger states |
|
Vision Valley (N. Sembilan) |
RM2.54 billion |
Emerging logistics corridor |
Earlier stage; fewer comparable transactions to benchmark against |
Source: NAPIC Property Market Report, 2025.
Klang Valley:
- Selangor recorded RM15.01 billion in industrial transactions in 2025, more than any other state.
- Its growth rate slowed from 15.7% in 2024 to 11.0% in 2025.
- New data-centre approvals in the state now depend on confirmed TNB grid capacity.
Johor:
- The RTS Link remains on schedule for completion by 31 December 2026.
- The JS-SEZ master plan has been completed and approved by Cabinet.
- Its public launch has been delayed twice, from end-2025 to March 2026, and is now targeted for Q4 2026, after the Johor state election.
- Sites priced against JS-SEZ certainty may carry that timing gap as risk.
Vision Valley:
- Negeri Sembilan recorded RM2.54 billion in industrial transactions in 2025.
- It remains an earlier-stage corridor, with fewer comparable transactions to benchmark against.
Related reading: Why ASEAN Investors Are Choosing Malaysia Vision Valley for Industrial Property
Pro Tip: Comparing a corridor’s 2025 value growth against its 2024 base can help before assuming this year’s momentum will repeat.
What Should You Consider If You’re Relocating or Expanding in H2 2026?
Sites with power allocation confirmed in writing tend to carry lower execution risk. Sites where confirmation, or the JS-SEZ master plan, is still pending may carry more uncertainty.
Power allocation lead times increasingly shape project timelines:
- TNB’s expedited connection process has targeted around 12 months for qualifying projects, down from a typical 36 to 48 months.
- This depends on grid capacity in the specific area and the project’s classification.
Budget 2026 directs some funding toward the sectors driving this demand:
- Budget 2026’s total allocation is RM419.2 billion across the whole federal budget. This is not a sector-specific figure.
- Within it, RM550 million from Khazanah and KWAP is earmarked for the semiconductor ecosystem.
- A further RM180 million is allocated to the NIMP Industry Development Fund, covering pharmaceuticals, semiconductors, AI, digital, and sustainability.
One risk in this market is relying on the country-level headline rather than the corridor-and-factor level detail. A 21.3% national value surge does not mean every industrial plot benefits equally, or on the same timeline.
|
If Your Site Scores… |
|---|
|
3 or 4 out of 4, power confirmed: locking in sooner may carry lower risk. 2 or fewer, or power pending: waiting for the next data cycle may reduce uncertainty. |
What Is Worth Watching for in the Rest of 2026?
A few indicators are worth tracking through the second half of the year: TNB power approvals, the JS-SEZ master plan launch, RTS Link’s completion, and Budget 2026 disbursement pace.
- NAPIC’s H2 2026 industrial breakdown: expected in the next quarterly report cycle
- RTS Link: targeted completion 31 December 2026, operational January 2027
- JS-SEZ master plan: approved but not yet publicly launched; now targeted for Q4 2026
- TNB Regulatory Period 4 grid upgrades: running through December 2027
Until official H2 2026 figures are available, the four-factor framework above offers one way to weigh a specific site against current conditions, rather than relying on the national headline alone.
Frequently Asked Questions
Is Malaysia’s industrial property market still growing in 2026?
Based on the latest confirmed data, yes. National industrial transaction value rose 21.3% in 2025 to RM33.80 billion. Demand drivers, data centres, semiconductors, and logistics, remain active into 2026. Growth is not even across every corridor.
Which is better for a factory: Klang Valley, Johor, or Penang?
It depends on priorities. Klang Valley offers the largest transaction volumes and Port Klang access. Johor offers JS-SEZ incentives and RTS Link connectivity, though the master plan’s public launch is still pending. Penang shows steadier, more moderate growth.
Why is industrial land near data centres sometimes priced higher in Malaysia?
Land near confirmed, power-allocated data centre projects can command a premium. TNB capacity is limited, and the approval process increasingly screens for execution certainty rather than location alone.
How long does it take to get TNB power allocation for a new factory?
TNB’s expedited connection process has targeted around 12 months for qualifying projects, down from a typical 36 to 48 months. This depends on grid capacity in the specific area and the project’s classification.
What is the JS-SEZ and how does it affect industrial property?
The Johor-Singapore Special Economic Zone is a bilateral agreement signed in January 2025. It offers tax incentives and infrastructure upgrades across southern Johor. Its master plan has been completed and approved by Cabinet, but the public launch has been delayed twice and is now targeted for Q4 2026.
Conclusion
Malaysia’s industrial property sector expanded through 2025. National value growth of 21.3%, TNB’s data-centre pipeline, and Johor’s infrastructure catalysts point to sustained demand at a national level. That growth has not been even across every site.
The four-factor framework, power allocation, title readiness, sector overlap, and infrastructure timing, offers one way to assess where a specific site sits within that picture. It is not a substitute for site-specific due diligence, but it can help separate a site’s underlying fundamentals from the national headline.
Related reading: A Practical Guide to Commercial and Industrial Property in Malaysia
|
Get Your Site Scored Against These Four Factors Industrial space that fits your operation is not always the space that is available. Speak to a Hartamas Industrial consultant and get a shortlist matched to your zoning, power, and logistics requirements. Not sure how your target site scores against the four factors above? Tell us the location and we will assess it, no obligation. |
|---|
Sources
- NAPIC Property Market Report 2025 — National Property Information Centre (official portal)
- Ministry of Energy Transition and Water Transformation (PETRA) / TNB data centre supply figures, 7 July 2026
- TNB grid capacity assessment, Dewan Rakyat written reply, 7 July 2026
- RTS Link construction progress and completion timeline
- JS-SEZ master plan status, Johor state government / Economy Ministry statements, July 2026
- Budget 2026, total allocation — Ministry of Finance Malaysia
- Budget 2026, sector allocations — Prime Minister’s tabling speech
- TNB One-Stop-Centre / Green Lane Pathway connection timeline